
Introduction
As a software engineer, I rely heavily on my workflow to stay productive. For example, I use Raycast to switch quickly between Git repositories and applications, zsh functions to execute commonly used commands, and key bindings in my IDE.
In my new role this year, I had to pick up Go, which meant learning new IDE extensions and conventions. The biggest pain point for me over the past year of developing in Go has been running tests and using the test debugger. Previously, I developed in Ruby and there were great extensions that allowed me to run tests quickly with just key bindings, for example cmd+l. That had been my development flow for three years. This year, it felt like that flow was interrupted because I could no longer rely on key bindings. On top of that, the codebases I work on use a table‑driven test structure and the testify package which unfortunately, there were no extensions that could run or debug tests seamlessly, because they could not easily detect the table‑driven test structure and testify conventions.
This was a common pain point among my teammates as well. Last month, I worked on a refactoring task that failed a number of tests due to changes in business logic across various scenarios, and my current development flow made fixing them really painful. That pushed me to build my own VS Code extension to solve this pain point once and for all.
Why Was Running and Debugging Tests So Painful?
Most of the solutions available do not work well with table‑driven test structure and testify conventions, and this has led to arduous workarounds.
Running A Single Test Case Took 5 Steps
Current solutions out there rely on CodeLens to display “run test” and “debug test” buttons above each test in the IDE, like this:
// run test | debug test
func TestAddition(t *testing.T) {
	// run test | debug test
	t.Run("add positive integers", func(t *testing.T) {
		assert.Equal(t, 5, addition(2, 3))
	})

	// run test | debug test
	t.Run("add negative integers", func(t *testing.T) {
		assert.Equal(t, -5, addition(-2, -3))
	})
}
When tests are written in a table‑driven style, the CodeLens only displays the “run test” and “debug test” buttons at the test method or test suite level. This is also the case in the test explorer tab. This means I can only run the entire test suite or test method, instead of a single test case. That becomes annoying to deal with, especially when I need to fix just 1 out of 10 test cases.
// run test | debug test
func (s *AdditionSuite) TestAddition() {
	testCases := map[string]struct {
	  testInput input
	  expected  int
	}{
	  "test case 1": {
	    testInput: input{a: 1, b: 2},
	    expected:  3,
	  },
	  "test case 2": {
	    testInput: input{a: 3, b: 2},
	    expected:  5,
	  },
	}

	for name, tc := range testCases {
	  s.Run(name, func() {
	    actual := addition(tc.testInput.a, tc.testInput.b)
	    s.Equal(tc.expected, actual)
	  })
	}
}

// run test | debug test
func TestAdditionSuite(t *testing.T) {
	suite.Run(t, new(AdditionSuite))
}
The only way around this was to generate the test case name and run the go test command in my terminal, which was such a manual and tedious process. Consider the above example test case, to run only the “test case 1” test case, I would need to craft the following terminal command:
go test -run TestAdditionSuite/TestAddition/test_case_1 -v ./path/filenameTo craft the above command, I had to:
- Identify the name of the test suite e.g. TestAdditionSuite
- Identify the test method within the suite to run e.g. TestAddition
- Identify the name of the test case e.g. test case 1
- Replace spaces with underscores e.g. converting “test case 1” into “test_case_1”
- Identify the relative file path e.g. ./path/filename
That is 5 steps just to run a single test case. I tried to alleviate step 4 by writing a custom Raycast script (a Spotlight replacement mentioned earlier) that lets me copy “test case 1” and paste it as “test_case_1” with opt+cmd+v.
Debugging A Single Test Case Took 6 Steps
Running the debugger was an even bigger hassle, and the workaround was more cumbersome. On top of generating the test name manually with the 5 steps above, I had to craft a different command:
dlv test --headless --listen=:2345 --api-version=2 ./path/filename -- -test.run TestAdditionSuite/TestAddition/test_case_1The above command requires a one‑time setup in VS Code’s launch.json with the necessary configuration so the process can be attached to the Delve debugger correctly:
{
  "version": "0.2.0",
  "configurations": [
    {
      "name": "Attach to Delve",
      "type": "go",
      "request": "attach",
      "mode": "remote",
      "port": 2345,
      "host": "127.0.0.1"
    }
  ]
}
Then go to VS Code’s “Run and Debug” tab to run the debugger.
That makes it 6 steps to debug a single test case. I had to fix close to 20 failing test cases across multiple test suites when I was working on the refactor so you can imagine the frustration here. A frustration that I wish to a put a stop to as I’m pretty sure this would happen again.
Building the VS Code Extension
I relied heavily on the vscode-run-rspec-file extension for my Ruby development workflow which I miss very dearly so I decided to build one for my Go development workflow too.
The extension needed to do 3 main things: detect where the cursor is positioned within a test, generate the correct test name based on the table-driven structure, and provide seamless key bindings for both running and debugging. VSCode has a pretty comprehensive documentation on the list of APIs that they have like commands and debug configurations. Together with Claude Code’s help, I managed to quickly scaffold the basic extension structure: command registration, keybinding definitions, and basic error handling. With that foundation in place, I could focus on the solution for the 2 problems:
- Generating the test case name to run based on where my cursor is
- Automatically attaching the process to the debugger UI
Generating Test Case Name
The codebases I work on use the testify package, and our test suites closely follow the conventions stated in the testify documentation. For example, all methods with the “Test” prefix run as tests within the suite:
func (s *AdditionSuite) TestAddition() {}And for go test to run the suite, we need a test function to run it:
func TestAdditionSuite(t *testing.T) {
	suite.Run(t, new(AdditionSuite))
}
The table‑driven style also follows Dave Cheney’s convention, where each subtest is given a name in the slice or map:
// map
"test case 1": {
  testInput: input{a: 1, b: 2},
  expected:  3,
  preFn:     func() {},
}
// slice
{
  name:      "test case 1",
  testInput: input{a: 1, b: 2},
  expected:  3,
  preFn:     func() {},
},
Since there was already a standardised convention in place, I could rely on the good-old regex to help identify the test suite name, test method name, and test case name. There could be more robust approaches compared to regex like AST parsing. Perhaps exploring AST parsing and validating how well it fares as compared to the regex solution could be another fun project to work on in the future. But for now, regex is simple and good enough to improve my development workflow quickly and I’m happy with the result of the regex solution so far!
Automatically Attaching the Process to the Debugger UI
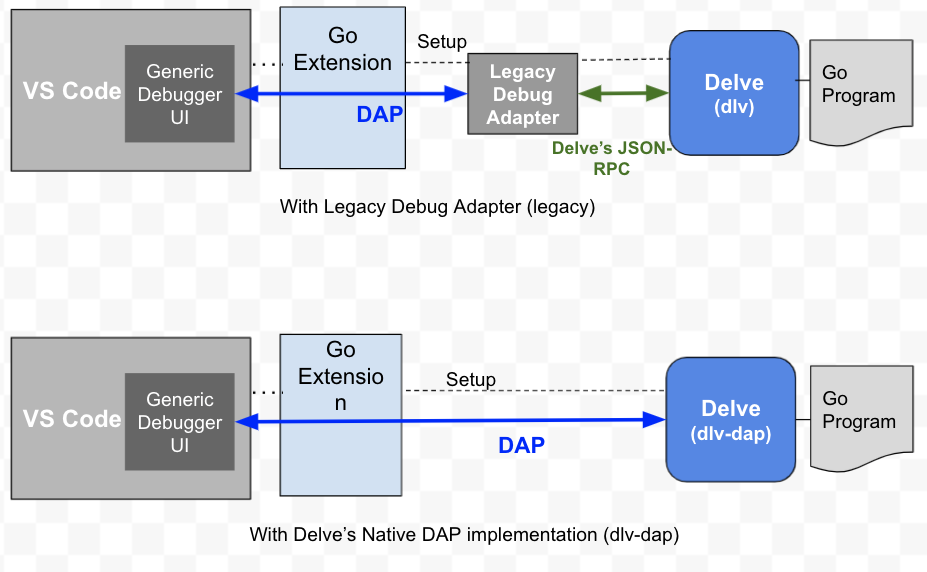
While digging into how the Delve debugger works with VS Code, I made some tweaks from the earlier setup so that it leverages the newer, native DAP implementation in Delve, which no longer requires a legacy debug adapter for VS Code to communicate with Delve via DAP.
The solution comprises of a 3 step process:
-
Identify an available port
This is important because not everyone has port 2345 available. To allow the extension to work for anyone, we should avoid hardcoding the port and instead use a built‑in JavaScript library like
netto launch the process on an available port. -
Run the Delve debugger process on the available port identified in (1)
Use
--accept-multiclient, which accepts connections via the DAP protocol. Previously with--api-version=2, only the JSON‑RPC protocol is accepted, which is the legacy implementation.bash dlv test --headless --listen=:${port} --accept-multiclient -- -test.run "${testName}" -
Attach the debugger to the VS Code UI
Since we no longer need the legacy debug adapter, we’ll specify
dlv-dapas the debug adapter when generating the configuration in the extension. Previously,debugAdapterwas not required because we were using the legacy approach.const debugConfig: vscode.DebugConfiguration = { name: SESSION_NAME, type: 'go', debugAdapter: 'dlv-dap', // VS Code relies on the DAP protocol to connect the Go program and debugger request: 'attach', mode: 'remote', port: port, host: DLV_HOST };This allows the user to step through code seamlessly with VS Code’s debugger UI.
How My Improved Development Workflow Looks
Now that the extension can identify and generate the test case name to run, and automatically attach the process to the debugger UI, we can rely on key bindings to execute the test runner and debugger quickly.
With the cmd+j key binding, the extension automatically generates the test case name and relative file path, then executes the test case in the terminal based on the cursor position.
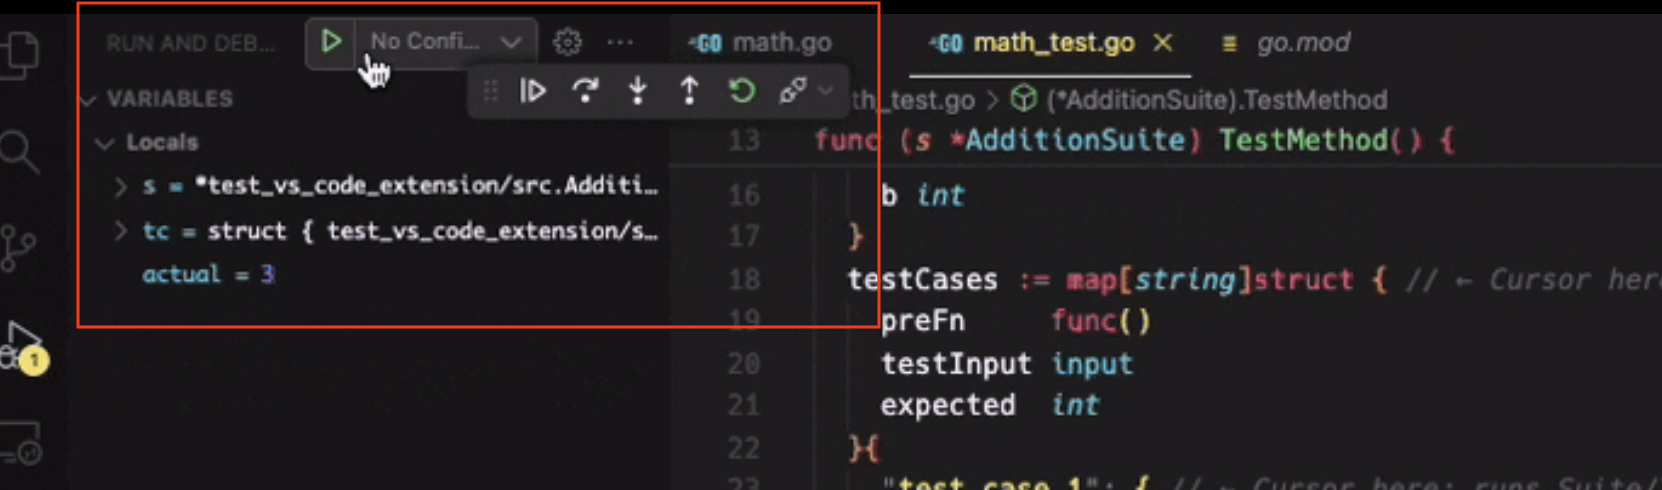
Similarly, with the shift+cmd+j key binding, the extension automatically launches the Delve debugger process and attaches it to the VS Code debugger UI.
Conclusion
From a 5 to 6 steps process to run the test and test debugger, I’m now just a cmd+j away from running them with the extension and this has helped me create a more productive development workflow. I have published the VS Code extension so my coworkers can benefit from it too.
If you write table‑driven tests and develop in VS Code, give the extension a try! Hopefully it will save you some time and we can all alleviate the same pain point together.